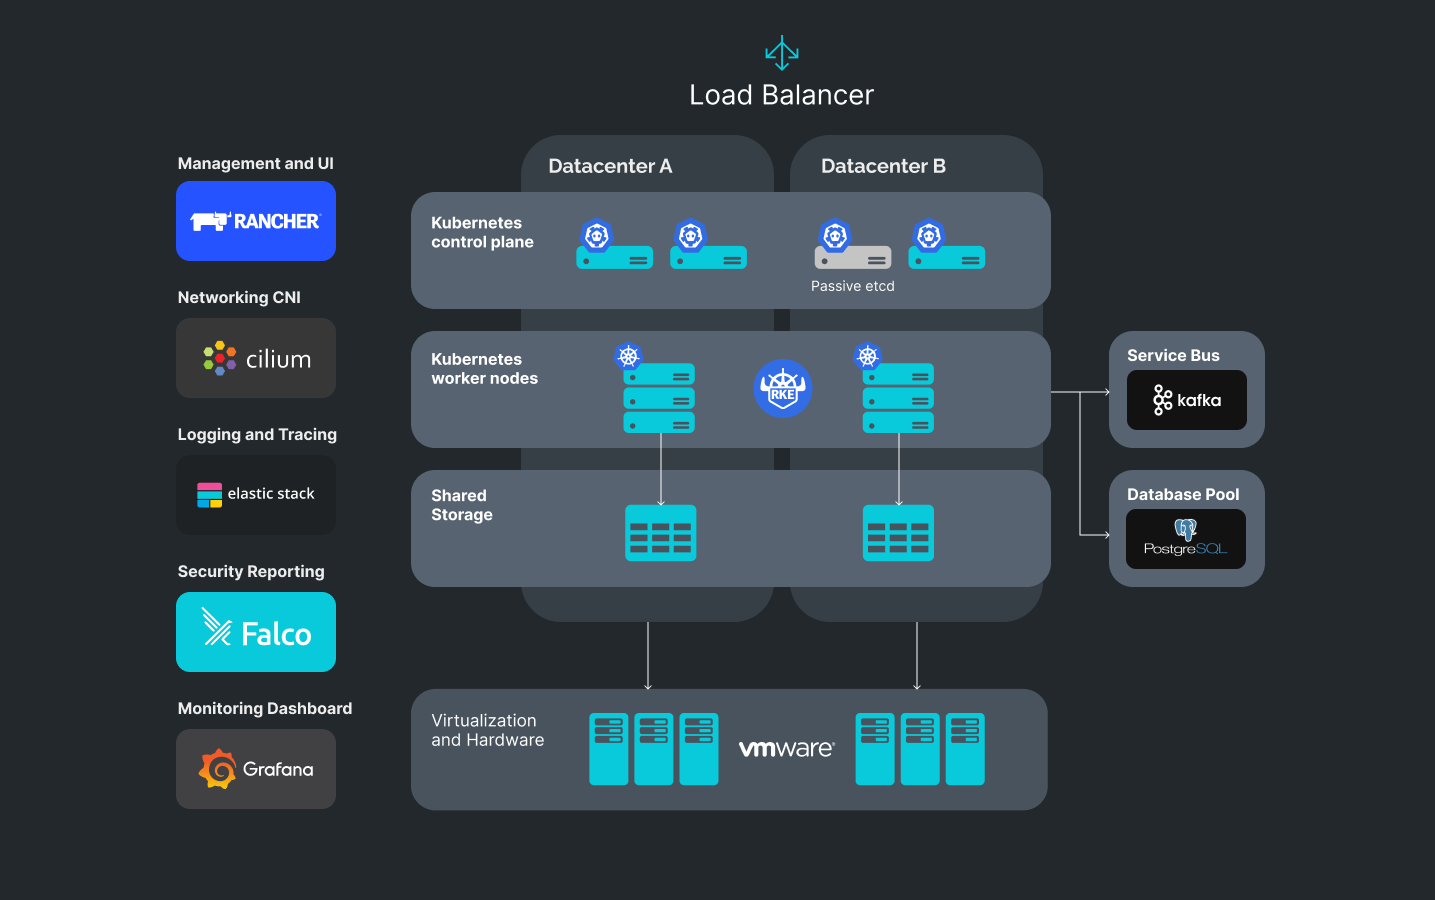
Example of a high available multi-DC cluster
Description:
1. The cluster can be simultaneously hosted in two datacenters. If the virtualization system allows, a part of the Control Plane can migrate from one datacenter to another without causing the workloads’ downtime. The time needed for switching is up to 2 minutes.
2. Container orchestration and cluster management is done by Rancher. The Rancher API allows to declaratively describe infrastructure in code, while its UI is convenient to visualize and manage services and users. Integration with AD is also possible.
3. Networking CNI plugin Cilium allows restricting access of user workloads to Layer 7, which significantly enhances security.
4. Logging and tracing are centrally managed and collected by means of the ELK stack. Typical dashboards allow for quick bug and incident investigation.
Metrics and alerting are managed by a de facto standard stack of Prometheus and Grafana.
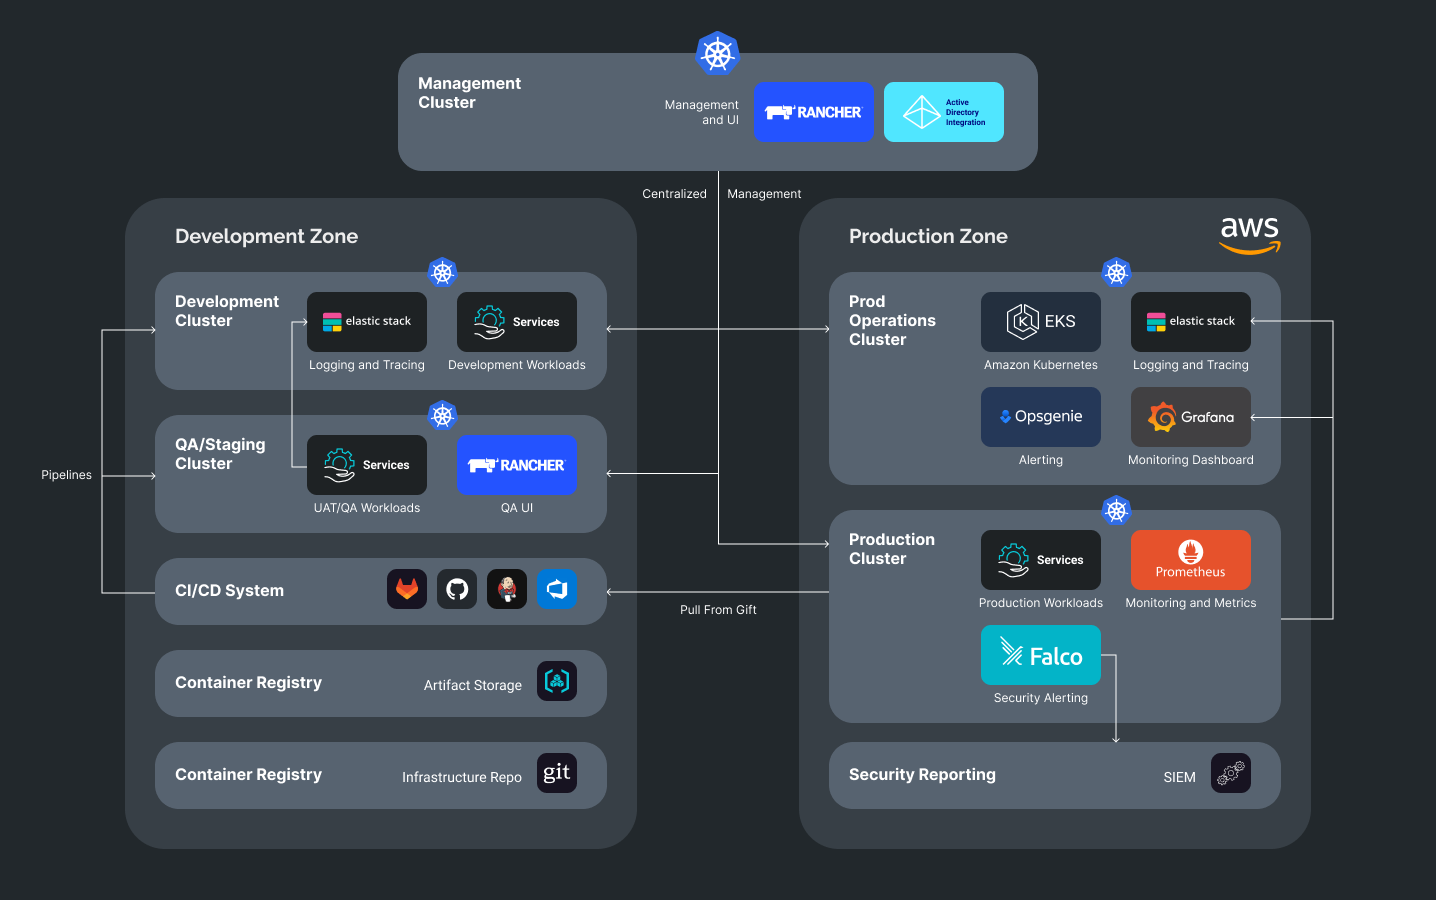
Diagram of the Infrastructure segmented on Development and Production zones
Description:
1. Centralized user management is done by Rancher server, which is integrated with AD.
2. Cluster management and Rancher UI can be either centralized or divided between the development and production zones.
3. Logging metrics and monitoring run in separate clusters so as not to affect the operation and security of user workloads.
4. The production zone includes aggregation of security reports based on Falco rules. The reports can be streamed into existing SIEM systems or into ElasticSearch with further visualization in Kibana.
5. CI/CD integration is possible either in push mode (when CI/CD system makes a direct deployment to a cluster), or by means of the pull GitOps approach, when a controller inside a cluster checks infrastructure repositories against changes and implements them with each new commit.