Loki is a lightweight and easy-to-operate log aggregation system. Developed by Grafana Labs, it is natively integrable with the Grafana toolset to compose a fully featured logging stack.
Sometimes, when we use Loki to visualize logs in Grafana, we may experience slow queries or even timeouts when processing large volumes of data. In this post I will show how to accelerate queries and make your dashboards work faster with Loki’s query cache. We will also practice how to find desirable logs faster by using Loki’s querying language.
Requirements
Kubernetes
You will need a Kubernetes cluster with Kubernetes v1.26.3 or newer. Some older versions should also be compatible, but you will need to try them.
Kubectl
We use Kubectl v1.26.3, see documentation on how to install it properly.
Helm
We use Helm v3.11.2, see documentation on how to install it properly.
Test environment setup
Kube-prometheus-stack
As a first step to take, we will install the kube-prometheus-stack Helm chart to deploy the basic monitoring stack. From there, we will use Grafana and Prometheus.
Apply this code to install the kube-prometheus-stack Helm chart to your Kubernetes cluster:
echo \
'
grafana:
  additionalDataSources:
    - name: Loki
      type: loki
      url: http://loki-gateway
      access: proxy
      editable: true
' \
> kube-prometheus-stack.yaml

helm repo add prometheus-community https://prometheus-community.github.io/helm-charts
helm repo update
kubectl create ns monitoring
helm upgrade --install kube-prometheus-stack prometheus-community/kube-prometheus-stack --version=45.7.1 -n monitoring -f kube-prometheus-stack.yaml
Memcached
We will use Memcached as a caching storage for our Loki installation.
Apply this code to install the Memcached Helm chart to your Kubernetes cluster:
helm repo add bitnami https://charts.bitnami.com/bitnami
helm install memcached bitnami/memcached --version=6.3.13 -n monitoring
Loki
To have our logs managed by Loki, we need to add the Loki Helm chart to our stack.
Apply this code to install the chart to your Kubernetes cluster:
echo \
'
loki:
  commonConfig:
    replication_factor: 1
  storage:
    type: "filesystem"
  auth_enabled: false
  memcached:
    results_cache:
      enabled: true
      host: "memcached"
      service: "memcache"
      default_validity: "1h"
singleBinary:
  replicas: 1
  persistence:
    enabled: true
    size: 2Gi
' \
> loki.yaml
helm repo add grafana https://grafana.github.io/helm-charts
helm repo update
helm upgrade --install loki grafana/loki --version=4.8.0 -n monitoring -f loki.yaml
Promtail
The Promtail agent collects our logs and sends them to Loki. To enable it for our installation, we need to add the Promtail Helm chart to our stack.
Apply this code to install the chart to your Kubernetes cluster:
helm upgrade --install promtail grafana/promtail --version=6.9.3 -n monitoring
Test our results
Now, having configured our test environment, let’s run a test query to check whether the cache is working.
Our Grafana service is running in a test environment, which is closed to external traffic. So, to access it, we need to forward the Grafana service to a local host. Let’s do this with kubectl by executing the command:
kubectl port-forward svc/kube-prometheus-stack-grafana -n monitoring 23000:80 > /dev/null 2>&1 &
In this command I specified the local connection port 23000. Normally, we use port 3000 as a default for Grafana. However, to avoid overlaps with local Grafana service on the host, I suggest adding 1 or 2 before 3000 to avoid using the same port by two services. Basically, you can use any port that is higher than 1024 as a connection point from your side.
1. Open Grafana in any web browser: http://127.0.0.1:23000
You can log in with default credentials or use your own if you specified them as values (variables) of the kube-prometheus-stack Helm chart.
Default credentials:
User: admin
Password: prom-operator
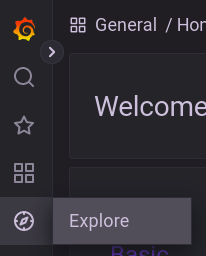
2. Open Explore section in our Grafana:
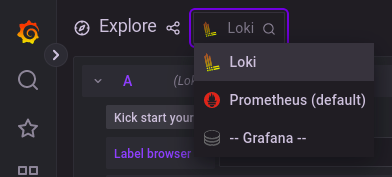
3. Pick Loki data source:
4. Enter test query to the command line:
rate({cluster="loki"}[5m])

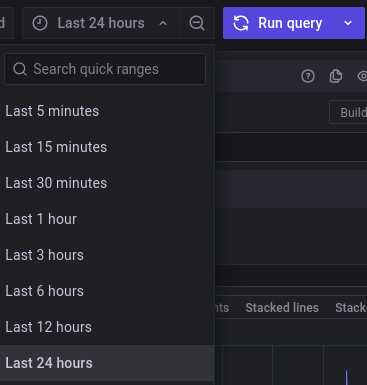
5. Set the query interval to 24h:
6. Open the query inspector:
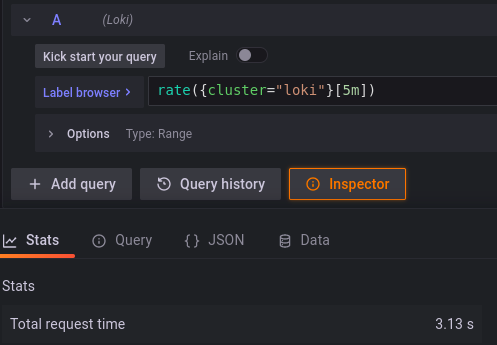
You will see that the total request time is 3.13 seconds. Now, if you run the query again, this time should be reduced:

That means that your cache is working!
How to speed up log search in Loki
LogQL, which is Loki’s querying language, has its own specifics and requires another approach to queries. Let’s see how its syntax can help us improve log search in Loki.
Sometimes you need to find some strings with a wide filter, as with this query:
sum(count_over_time({stream=~".+"} |~ "Completed loading of configuration file" [60s])) by (container)
In this example, we want to find in logs how many times the line “Completed loading of configuration file” has been within a 60 second interval during 24 hours. We use the log stream selector {stream=~”.+”} for the initial search.
The search results will be too broad as {stream=~”.+”} determines including in output log streams with any label, which is literally everything. In such a case we should count the number of matching logs to make the query faster. In our example, the function count_over_time counts all the log lines within the last 60 seconds that match the filter expression “Completed loading of configuration file”.
In the output we should see a graph like this:
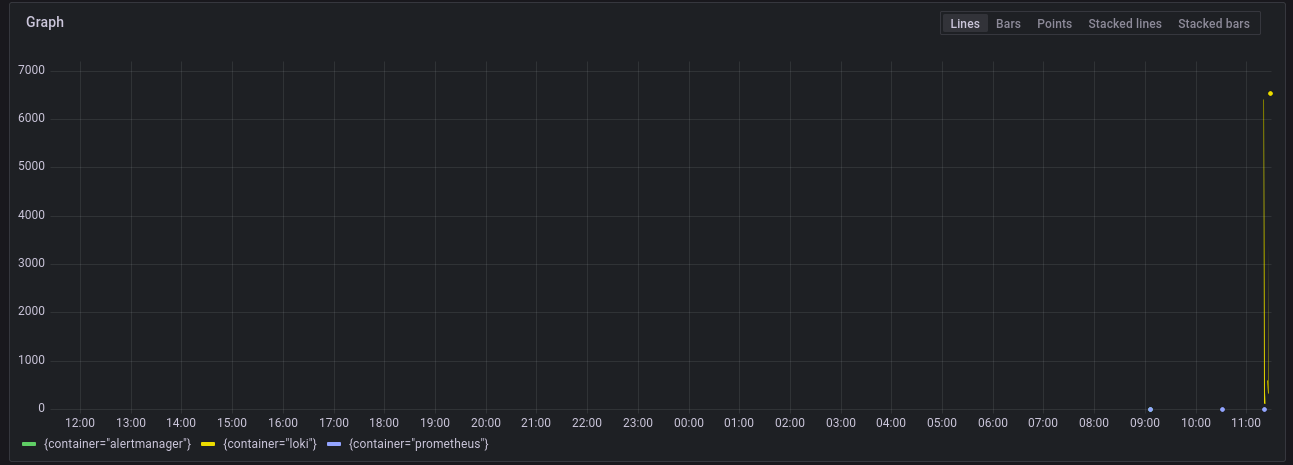
Now we can refine our query to reduce it. Let’s change our interval from 24 up to a few hours to narrow the search field:
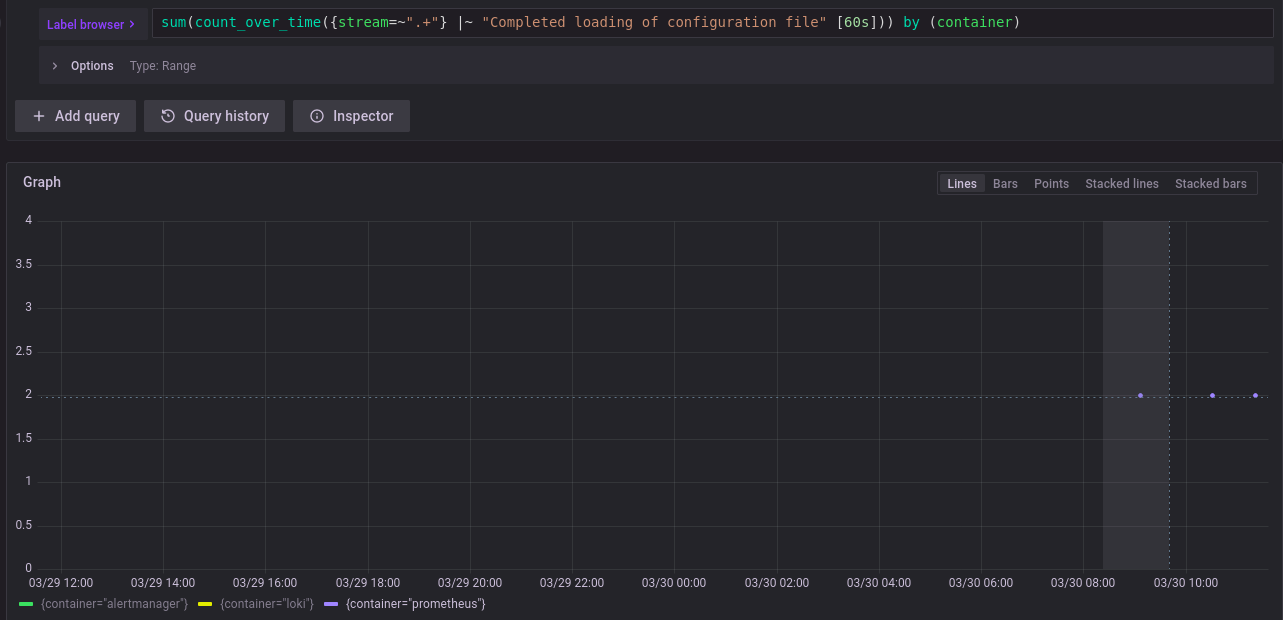
On the graph above we can see 3 containers that match our search. Now we should set the target container in second query:
{container="prometheus"} |~ "Completed loading of configuration file"
In the output we will see results according to our query:
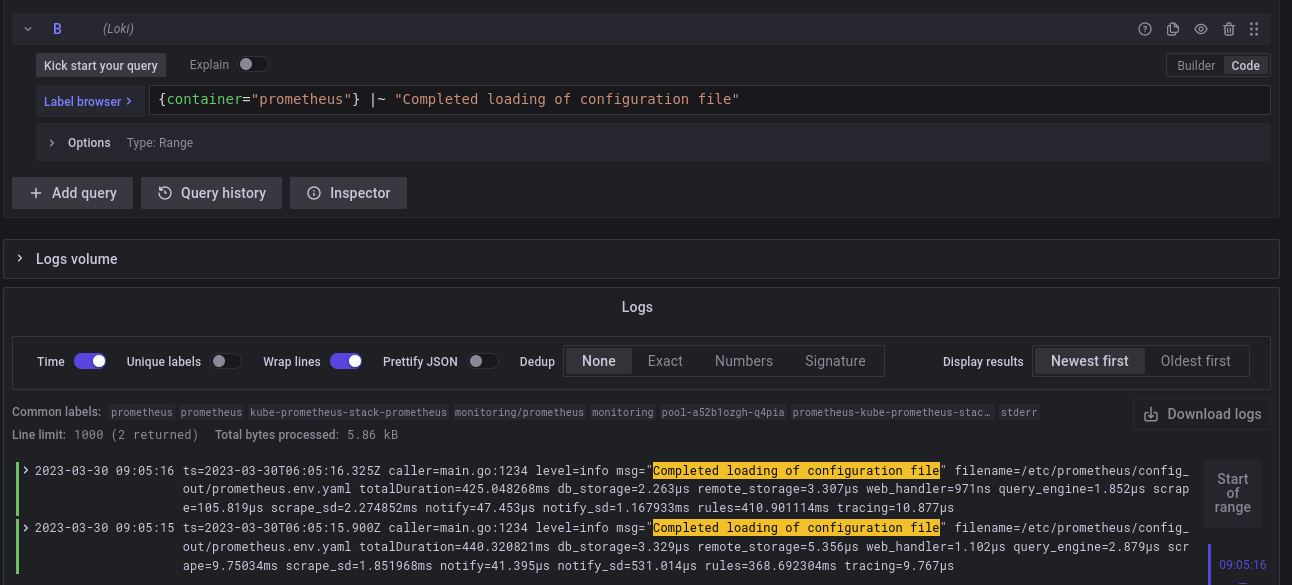
So the rule of thumb when filtering logs in LogQL is to search data as any counter first, and then watch the full log to make our queries faster.
Conclusion
In this post I have shown some simple and effective ways to make your Grafana Loki dashboards work faster and find desirable logs quicker. I hope this helps optimize your query performance and make your working with Grafana Loki stack easier.
