Grafana, in conjunction with Prometheus and Alertmanager, is a commonly used solution for monitoring Kubernetes clusters. The stack is universally applicable and can be used both in cloud and bare-metal clusters. It is functional, easily integrable and free, which accounts for its popularity.
In this article I will show how to integrate Grafana with Alertmanager, manage silences by means of Grafana, configure Alertmanager to inhibit alerts, and keep this configuration in code for future cases. Following the steps described below you will learn how to:
- add Alertmanager data source to Grafana by code
- configure Alertmanager to visualize alerts properly
- suppress some alerts via Alertmanager configuration
Requirements
You will need a Kubernetes cluster with installed `kube-prometheus-stack` Helm chart (version 39.5.0). You can use your existing cluster or deploy a testing environment. For an example, see our article Deploying Prometheus Monitoring Stack with Cluster.dev.
Introduction
Starting from v.8.0, Grafana is shipped with an integrated alerting system for acting on metrics and logs from a variety of external sources. At the same time, Grafana is compatible with Alertmanager and Prometheus by default – a combination that most of the industry community benefits from when monitoring Kubernetes clusters.
One of the reasons why we prefer using Alertmanager over a native Grafana alerting is because it is easier to automate when our configuration is in code. For example, while you can define in code Grafana-managed visualization panels to have them reused afterward, it will be much harder to manage. Alertmanager also comes together with Prometheus in the `kube-prometheus-stack` Helm chart – a resource we use to monitor Kubernetes clusters.
Grafana integration with Alertmanager
The first thing we do is configure Grafana integration with Alertmanager.
In order to make it automatic, add the following code to `kube-prometheus-stack` values:
2
3
4
5
6
7
8
9
10
additionalDataSources:
- name: Alertmanager
type: alertmanager
url: <a class="c-link" tabindex="-1" href="http://monitoring-kube-prometheus-alertmanager:9093/" target="_blank" rel="noopener noreferrer" data-stringify-link="http://monitoring-kube-prometheus-alertmanager:9093" data-sk="tooltip_parent" data-remove-tab-index="true">http://monitoring-kube-prometheus-alertmanager:9093</a>
editable: true
access: proxy
version: 2
jsonData:
implementation: prometheus
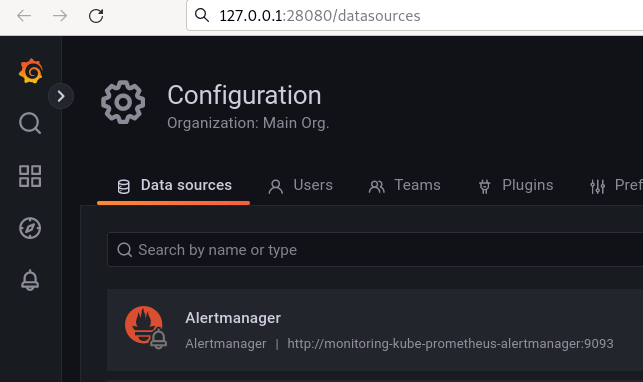
Customize the value of the `url:` key if it is different in your case. Deploy the code to your cluster and check it in Grafana data sources.
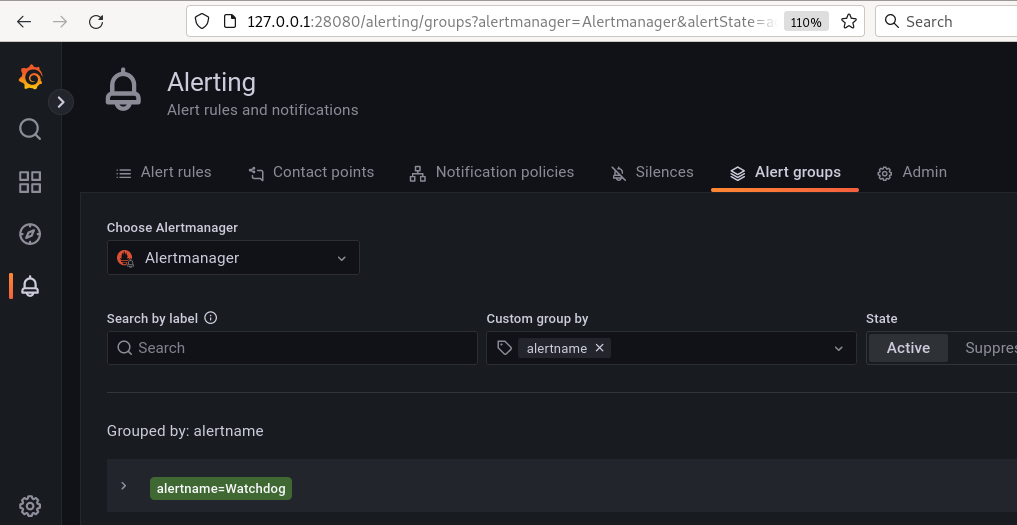
Then check active alerts – you should see at least one default alert.
Add Alertmanager configuration
Sometimes you can’t avoid alerts duplication during current integration, but I believe that in most cases it is possible. To see alerts without duplication you need to configure Alertmanager properly. This means having one receiver per alert.
In our case, to keep things simple we will add two receivers:
`blackhole` – for alerts with zero priority and no need to be sent
`default` – for alerts with severity level: info, warning, critical
The `default` receiver should have all needed notification channels. In our case we have two example channels – `telegram` and `slack`.
To automate the setup of Alertmanager configuration, add the following code to the `kube-prometheus-stack` yaml file:
2
3
4
5
6
7
8
9
10
11
12
13
14
15
16
17
18
19
20
21
22
23
24
25
26
27
28
29
30
31
32
33
34
35
36
config:
global:
resolve_timeout: 5m
route:
group_by: [...]
group_wait: 9s
group_interval: 9s
repeat_interval: 120h
receiver: blackhole
routes:
- receiver: default
group_by: [...]
match_re:
severity: "info|warning|critical"
continue: false
repeat_interval: 120h
receivers:
- name: blackhole
- name: default
telegram_configs:
- chat_id: -000000000
bot_token: 0000000000:00000000000000000000000000000000000
message: |
'Status: <a href="<a class="c-link" href="https://127.0.0.1/" target="_blank" rel="noopener noreferrer" data-stringify-link="https://127.0.0.1" data-sk="tooltip_parent">https://127.0.0.1</a>">{{ .Status }}</a>'
'{{ .CommonAnnotations.message }}'
api_url: <a class="c-link" href="https://127.0.0.1/" target="_blank" rel="noopener noreferrer" data-stringify-link="https://127.0.0.1" data-sk="tooltip_parent">https://127.0.0.1</a>
parse_mode: HTML
send_resolved: true
slack_configs:
- api_url: <a class="c-link" href="https://127.0.0.1/services/00000000000/00000000000/000000000000000000000000" target="_blank" rel="noopener noreferrer" data-stringify-link="https://127.0.0.1/services/00000000000/00000000000/000000000000000000000000" data-sk="tooltip_parent">https://127.0.0.1/services/00000000000/00000000000/000000000000000000000000</a>
username: alertmanager
title: "Status: {{ .Status }}"
text: "{{ .CommonAnnotations.message }}"
title_link: "<a class="c-link" href="https://127.0.0.1/" target="_blank" rel="noopener noreferrer" data-stringify-link="https://127.0.0.1" data-sk="tooltip_parent">https://127.0.0.1</a>"
send_resolved: true
Deploy the code to your cluster and check for active alerts – they should not be duplicated.
Add example inhibition rules
In some cases we want to disable alerts via silences and sometimes it is better to do it in code. Silence is good as a temporary measure. It is, however, impermanent and has to be recreated again if you deploy to an empty cluster. Disabling alerts via code, on the other hand, is a sustainable solution that can be used for repeated deployments.
Disabling alerts via silence is simple – just open the Silences tab and create one with a desired duration, for example `99999d`. If you have persistent storage enabled for Alertmanager such silence is permanent.
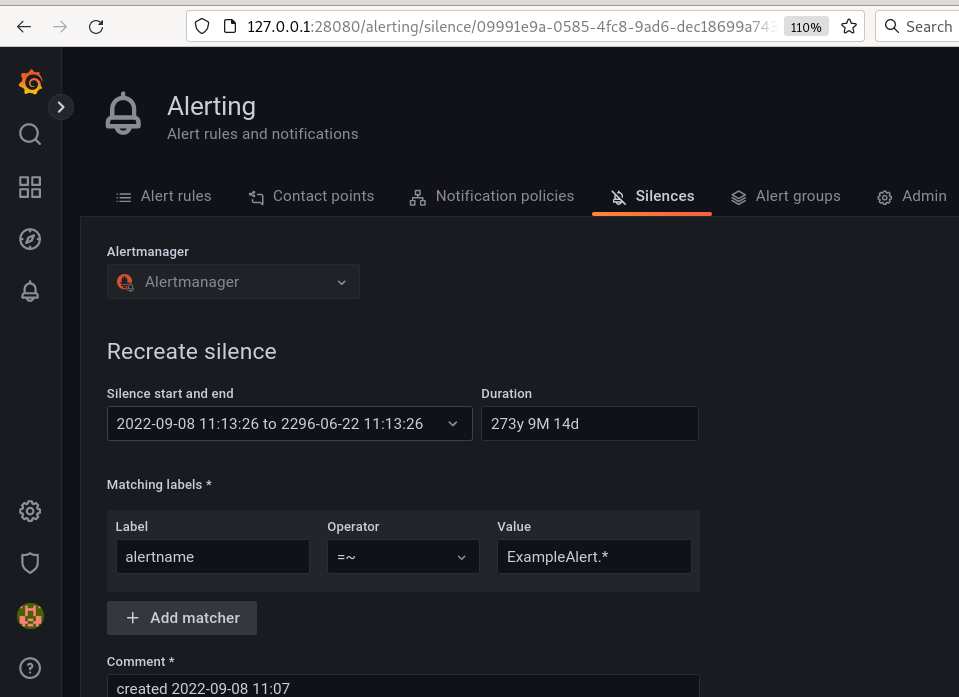
This section refers mostly to a second case, because adding silence as code is not an easy task. We will disable two test alerts by the `Watchdog` alert, which is always firing by default.
Add this code to `kube-prometheus-stack` yaml file:
2
3
4
5
- target_matchers:
- alertname =~ "ExampleTwoAlertToInhibit|ExampleOneAlertToInhibit"
source_matchers:
- alertname = Watchdog
The resulting code should look like this:
2
3
4
5
6
7
8
9
10
11
12
13
14
15
16
17
18
19
20
21
22
23
24
25
26
27
28
29
30
31
32
33
34
35
36
37
38
39
40
41
config:
global:
resolve_timeout: 5m
route:
group_by: [...]
group_wait: 9s
group_interval: 9s
repeat_interval: 120h
receiver: blackhole
routes:
- receiver: default
group_by: [...]
match_re:
severity: "info|warning|critical"
continue: false
repeat_interval: 120h
inhibit_rules:
- target_matchers:
- alertname =~ "ExampleAlertToInhibitOne|ExampleAlertToInhibitTwo"
source_matchers:
- alertname = Watchdog
receivers:
- name: blackhole
- name: default
telegram_configs:
- chat_id: -000000000
bot_token: 0000000000:00000000000000000000000000000000000
message: |
'Status: <a href="<a class="c-link" tabindex="-1" href="https://127.0.0.1/" target="_blank" rel="noopener noreferrer" data-stringify-link="https://127.0.0.1" data-sk="tooltip_parent" data-remove-tab-index="true">https://127.0.0.1</a>">{{ .Status }}</a>'
'{{ .CommonAnnotations.message }}'
api_url: <a class="c-link" tabindex="-1" href="https://127.0.0.1/" target="_blank" rel="noopener noreferrer" data-stringify-link="https://127.0.0.1" data-sk="tooltip_parent" data-remove-tab-index="true">https://127.0.0.1</a>
parse_mode: HTML
send_resolved: true
slack_configs:
- api_url: <a class="c-link" tabindex="-1" href="https://127.0.0.1/services/00000000000/00000000000/000000000000000000000000" target="_blank" rel="noopener noreferrer" data-stringify-link="https://127.0.0.1/services/00000000000/00000000000/000000000000000000000000" data-sk="tooltip_parent" data-remove-tab-index="true">https://127.0.0.1/services/00000000000/00000000000/000000000000000000000000</a>
username: alertmanager
title: "Status: {{ .Status }}"
text: "{{ .CommonAnnotations.message }}"
title_link: "<a class="c-link" tabindex="-1" href="https://127.0.0.1/" target="_blank" rel="noopener noreferrer" data-stringify-link="https://127.0.0.1" data-sk="tooltip_parent" data-remove-tab-index="true">https://127.0.0.1</a>"
send_resolved: true
Deploy the code to your cluster. Add test alerts with the following code:
2
3
4
5
6
7
8
9
10
11
12
13
kind: PrometheusRule
metadata:
name: test-rules
namespace: monitoring
spec:
groups:
- name: "test alerts"
rules:
- alert: ExampleAlertToInhibitOne
expr: vector(1)
- alert: ExampleAlertToInhibitTwo
expr: vector(1)
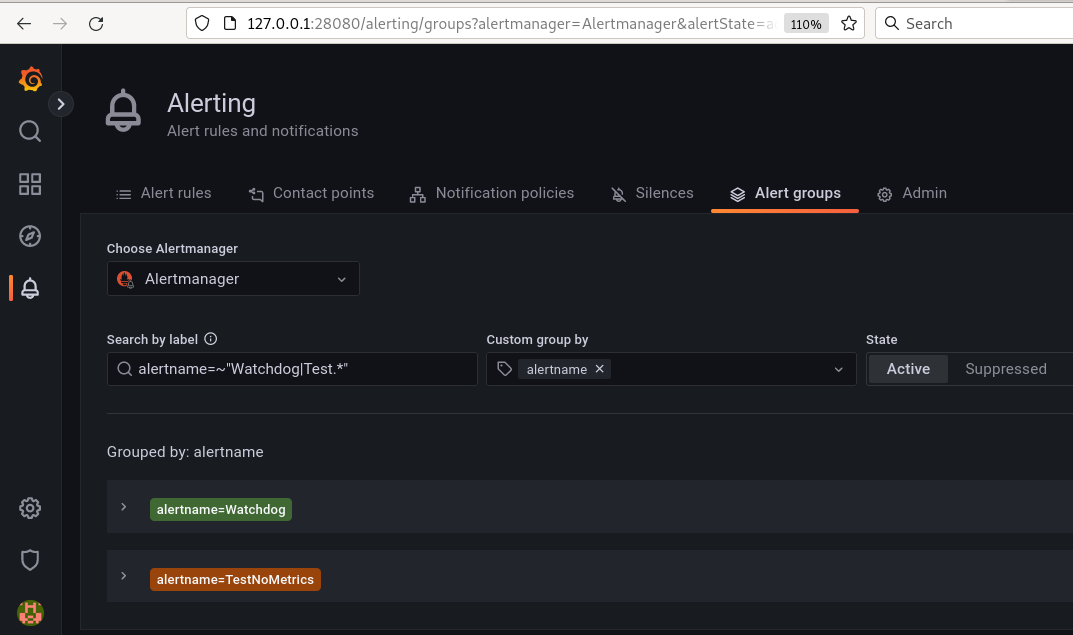
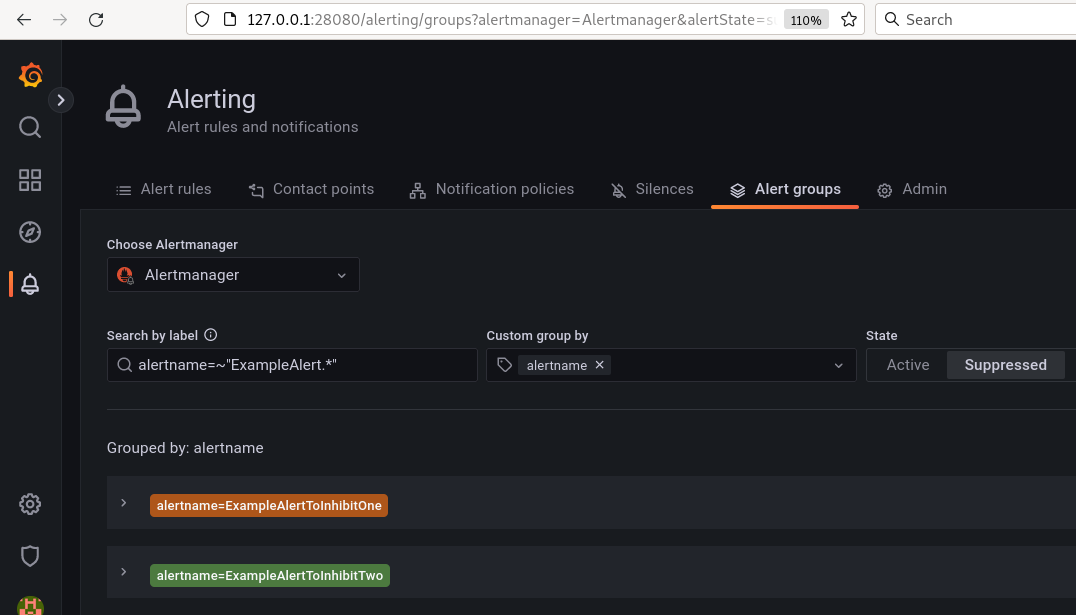
Deploy the code with test alerts to your cluster, check the existence of our test rules in the rules list. Wait for 1-3 minutes to see the test alerts; those alerts should be suppressed.
Conclusion
In this article we have reviewed a generic case of integrating Grafana with Alertmanager, learnt how to manage silences in Grafana, and inhibit alerts via Alertmanager in code. Now you will be able to manage your alerts in an easy and reproducible way with minimal code. Basic code examples are ready to be used in your projects and can be applicable to any configuration.
